/filters:quality(90)/fit-in/970x750/coros-web-faq/upload/images/b20e34c4901694a6c9e86279d42d49d2.jpg)
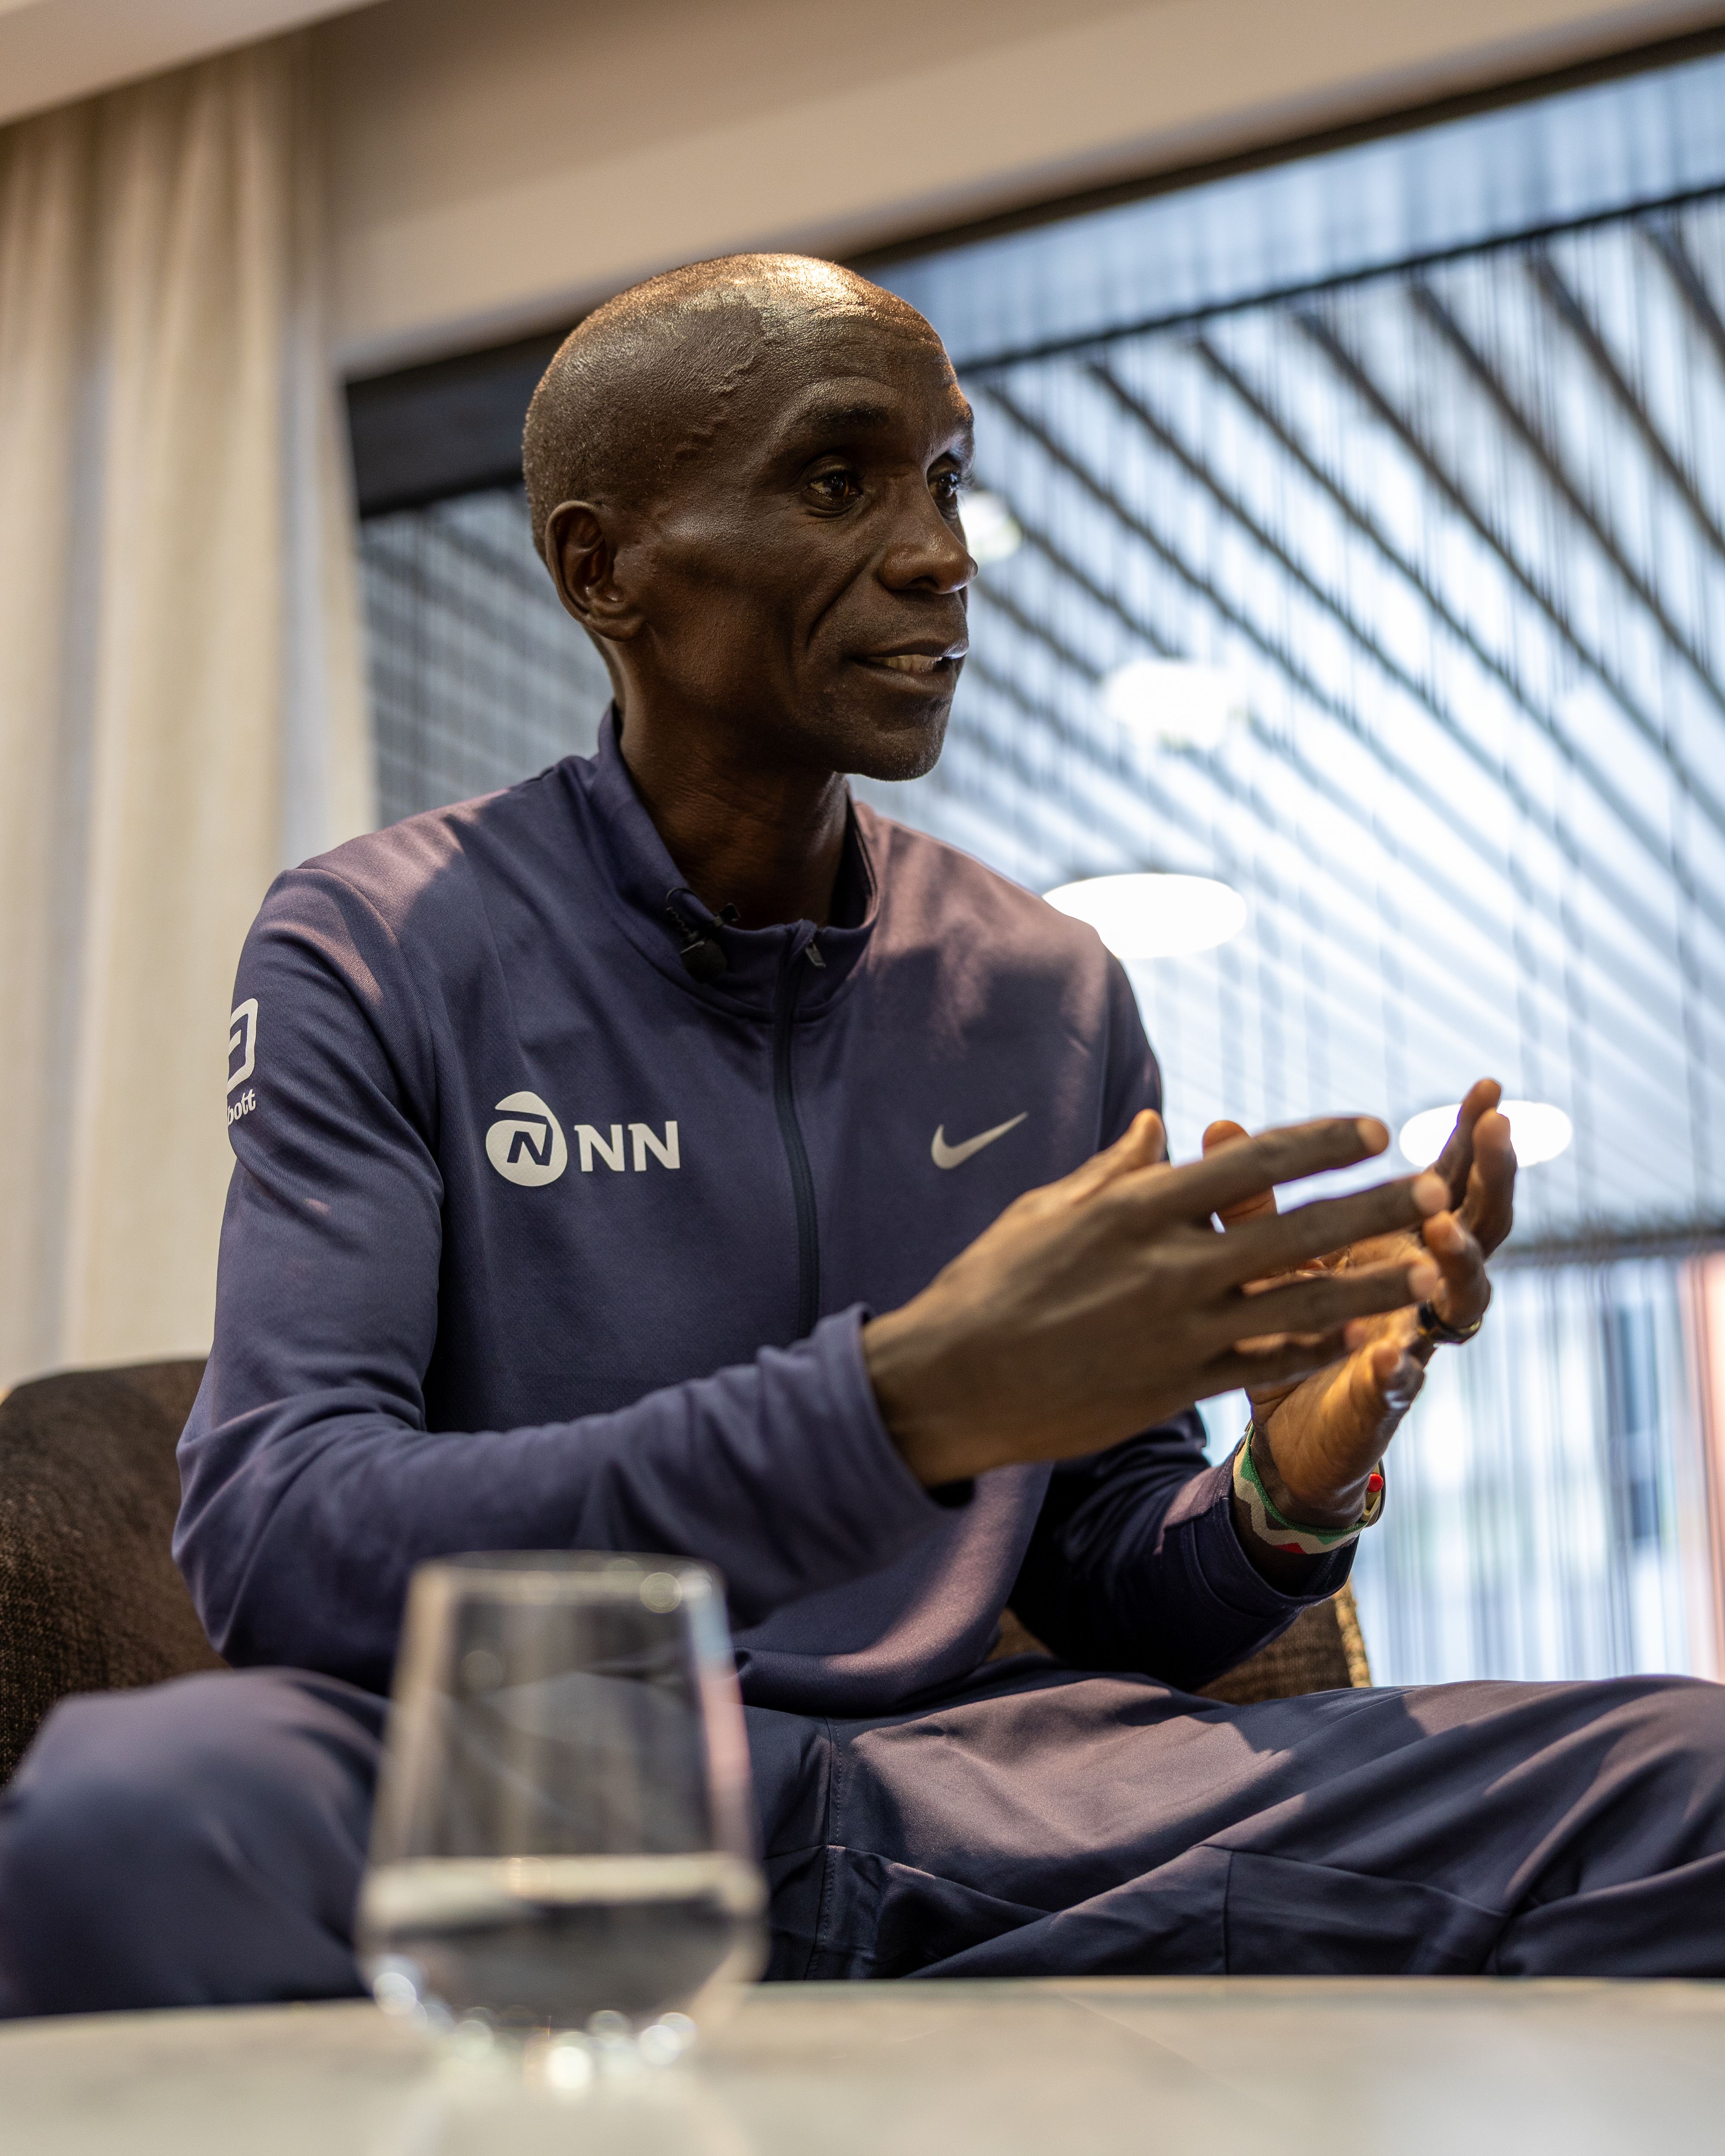
When Olympic triathlon champion Alex Yee met marathon legend Eliud Kipchoge at the 2025 London Marathon, it was more than a handshake between two elite athletes—it was a learning opportunity.
In his marathon debut, Alex Yee clocked a blistering 2:11:08. The performance looked composed from the outside, but the data revealed a deeper story. Like many first-time marathoners, the final miles tested him. Eliud Kipchoge, former world record holder and the first man to break the two-hour barrier, offered reassurance:
"Yes it's normal. This is your debut. So next time you, you know you really learn from it."
After the race, Yee and Kipchoge sat down to analyze the performance using Alex's COROS data. What emerged was a clear and powerful lesson—not just for Yee, but for every runner focused on improvement.
Here are three ways you can analyze your marathon data, find what's important, and use it to take the next step in your running journey:
1. Effort Over Time: Use Zone Distribution
Your Heart Rate and Pace Zones show how your intensity shifts throughout a race.
- Did you start strong but redline too early? Were you able to maintain Zone 3 (aerobic power) deep into the race, or did you creep into Zone 4 (threshold) too soon?
- A well-paced marathon keeps you efficient early and only pushes into threshold in the final miles. If your zones show an early entry into Zone 4, pacing or fueling likely broke down.
COROS Tip: Use Activity Alerts on your COROS device can help keep to your desired pace early on and keep you fuelling throughout the race.
2. Learn from Every Split

Don’t just look at your average pace—zoom in on smaller segments each mile or every 5 kilometers.
- Did your pace drop but HR stay steady or rise? That’s fatigue.
- Where was the tipping point for you? This could help with your future training runs.
COROS Tip: Use the lap chart view in the COROS app or Training Hub for a detailed view of your pace, heart rate, and cadence, and how they changed over the course of the race.
3. Focus on Form: Break Down your Cadence and Stride Length
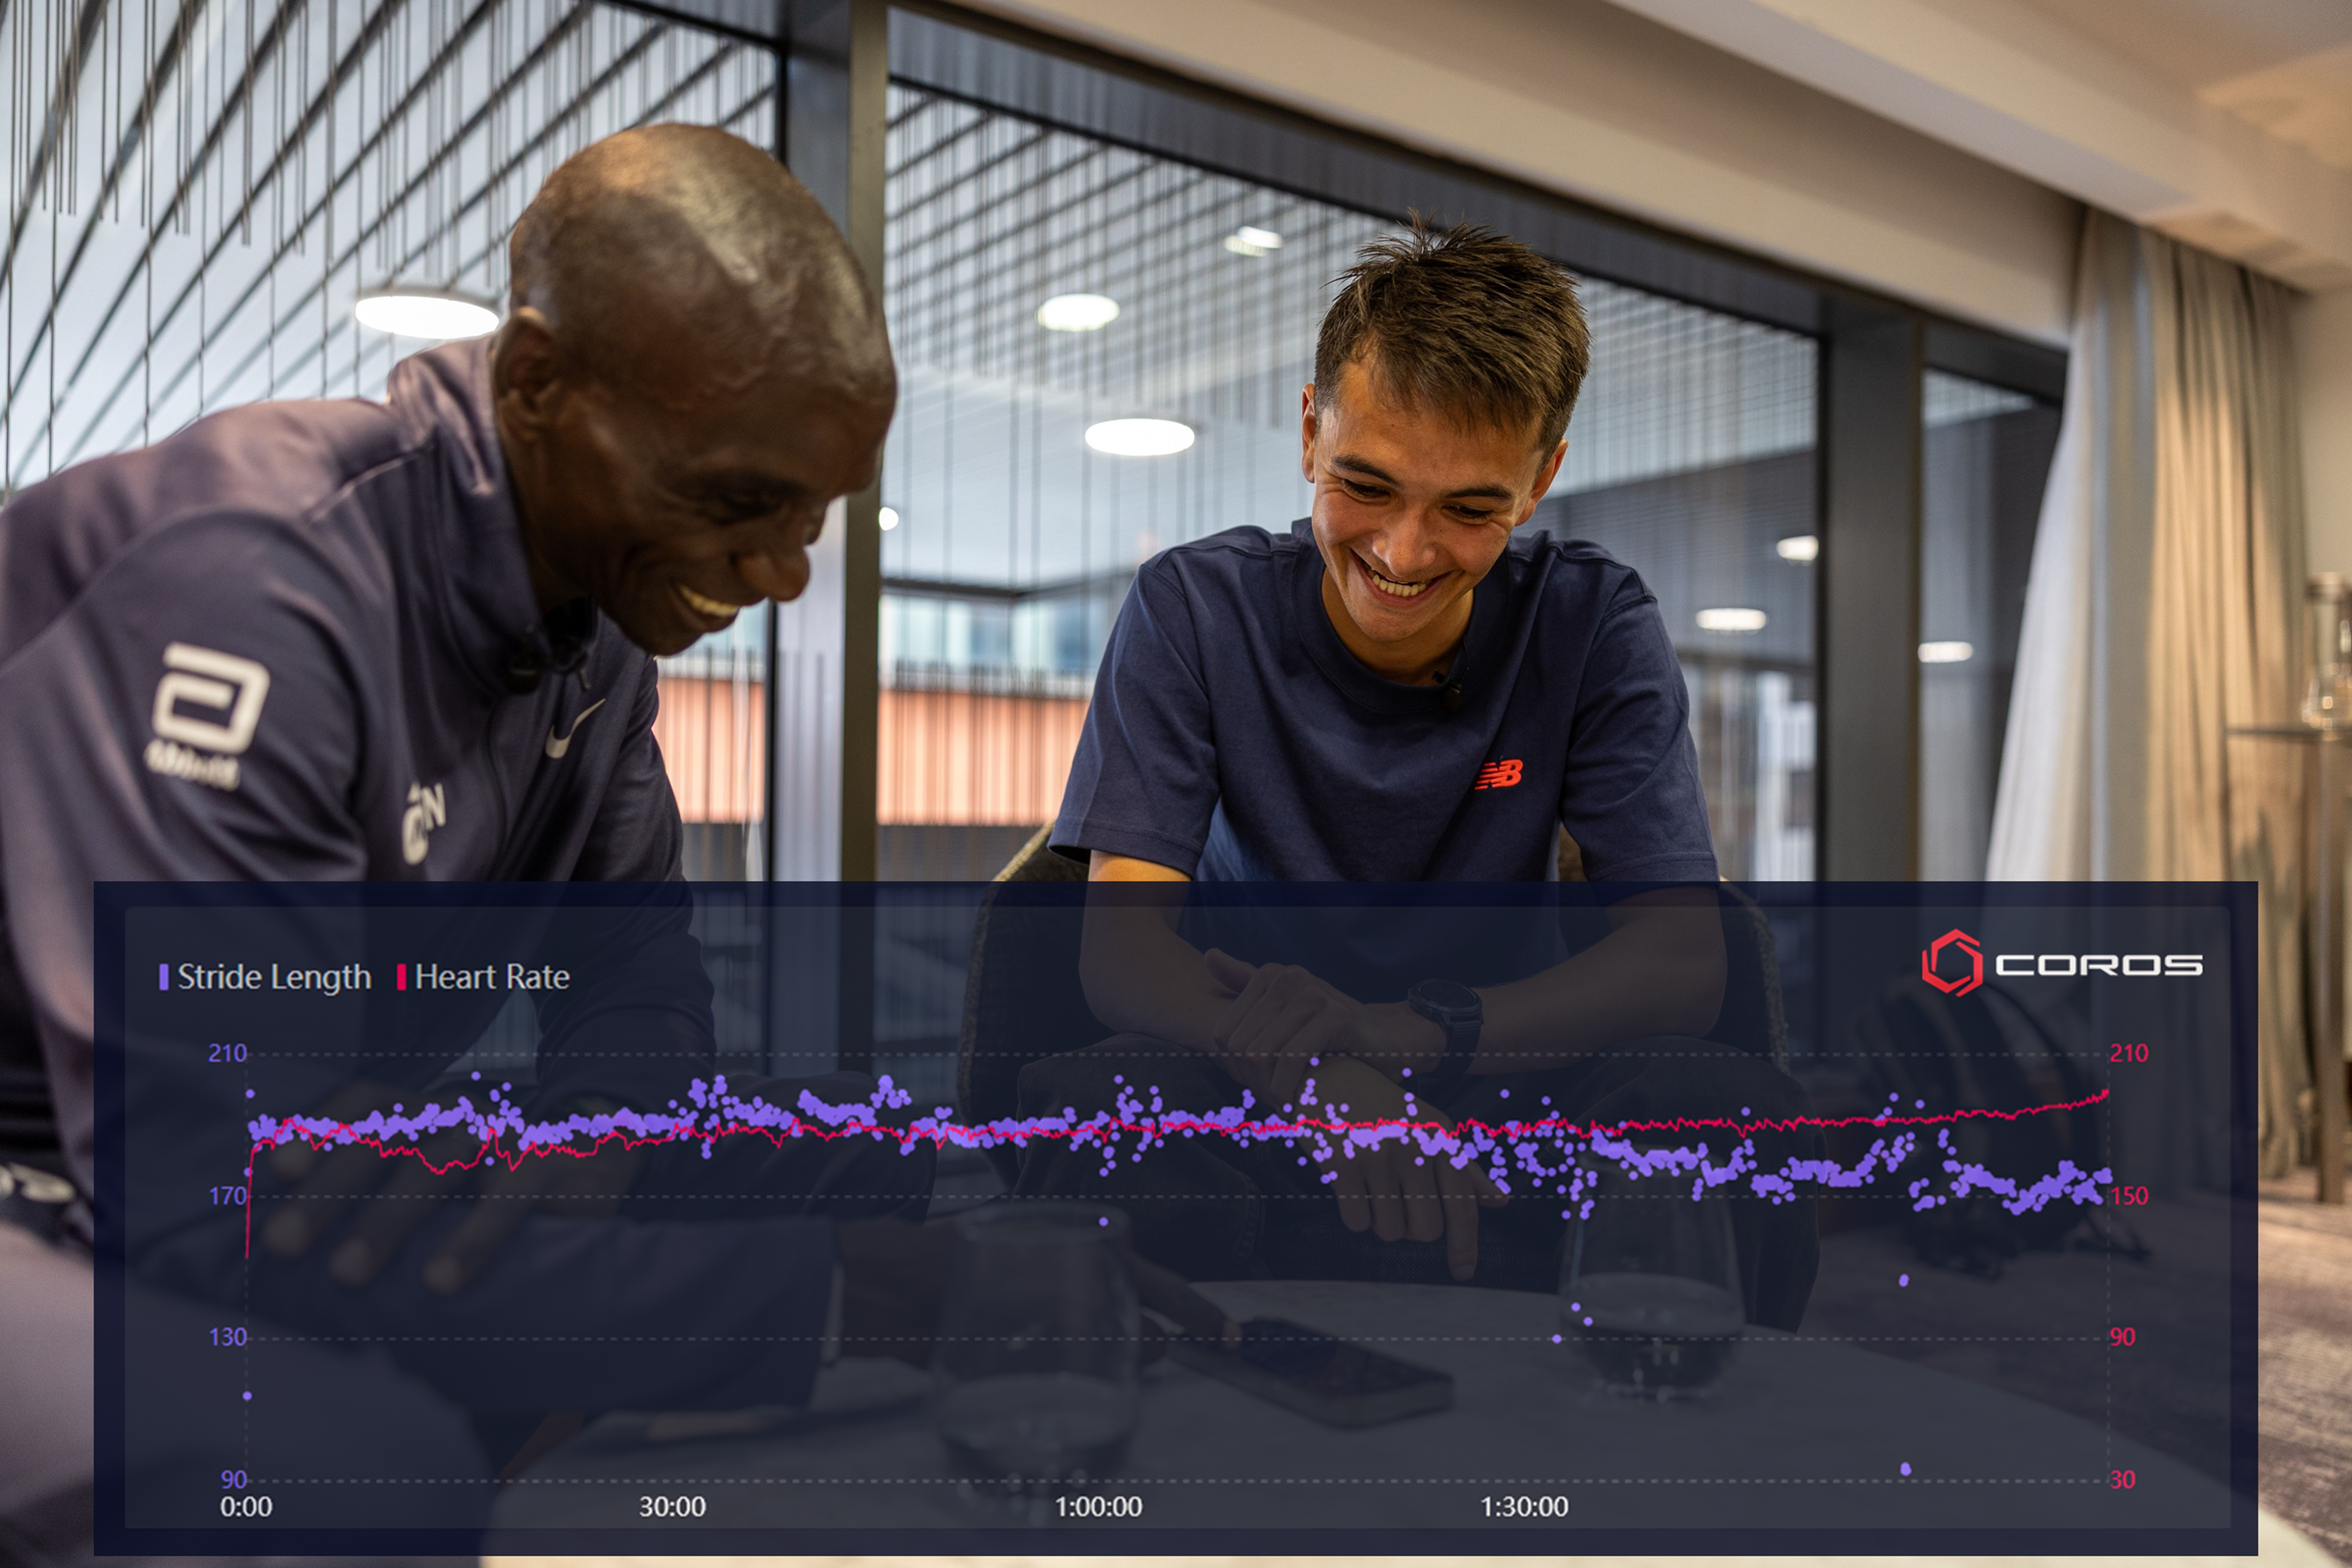
Alex Yee's stride length and heart rate data from the London Marathon
Marathon fatigue hits your form first. With COROS, you can view cadence and stride length breakdowns directly in your activity summary. Spot a steady drop? That’s a cue to work on your strength.
- A gradual drop in stride length may indicate muscular fatigue.
- A decline in cadence could mean you're overstriding or struggling with turnover.
COROS Tip: Use the COROS POD 2 for enhanced accuracy on cadence and stride-related metrics and take a regular Running Form test to see how you can improve.
The Takeaway: Data is Your Coach
After the race, the result wasn't the only thing that mattered for Alex:
"Success for me is not always driven by an outcome. I think it can be driven by an effort, by achieving something within a process."
That mindset resonated in his post-race conversation with Eliud Kipchoge, who emphasized that data can reveal how a race truly unfolded—where you pushed, where you faded, and where your strengths held up.
"The data can tell a story of how we like to run it. Where you go fast and where you go slow and where you maintain the skills. If you are struggling a little bit, actually at the end of it, then the data can show you what you are struggling with."
Together, they highlighted something powerful: Learning from a race isn’t reserved for elites. The data is there. The insight is there. The next step is yours.