/filters:quality(90)/fit-in/970x750/coros-web-faq/upload/images/264a4d16e3f3d06bde1a90ba0016f89e.png)
EvoLab includes many metrics to help you train smarter, but at the core of it all is Training Load. Whether you're running, cycling, or training in another sport, it's easy to fall back on weekly mileage or hours to track progress. But not all miles or minutes carry the same weight. Training Load goes a step further by combining volume and intensity into one metric, giving you a clearer picture of how much stress your body is really under.
How do different workouts affect your body? How can you tell if you’re doing too much... or not enough? Which workouts will produce the best results? Training Load is the metric that helps you answer those questions, and more.
What is Training Load?
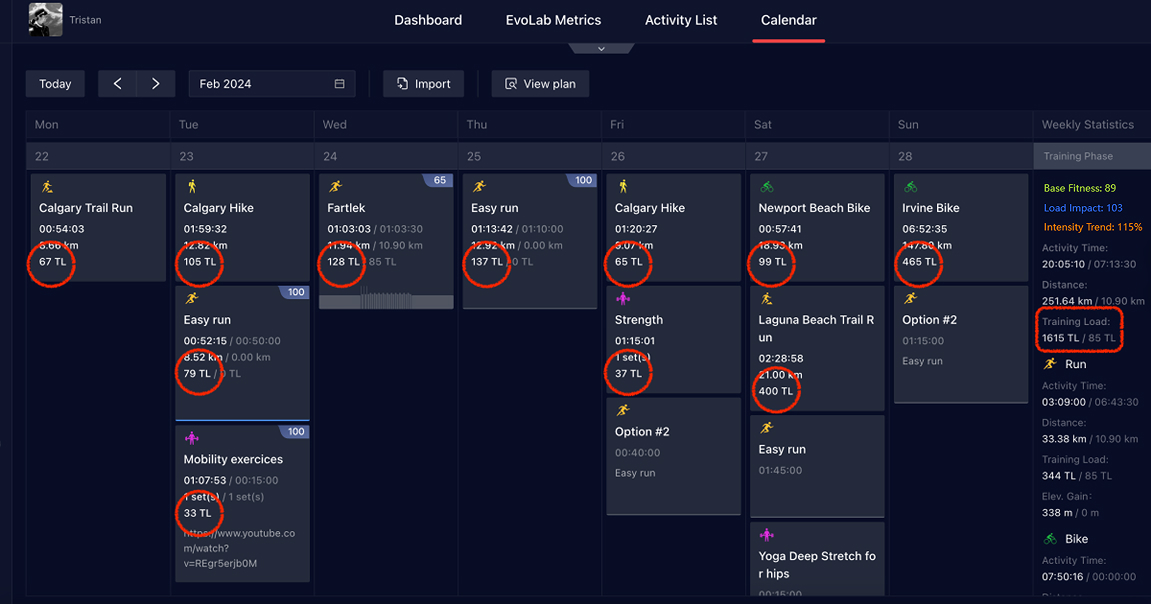
Training Load values of all activities displayed on the Calendar tab of the Training Hub.
Training Load (TL) refers to a singular value displayed on each activity to quantify those activities and tell you how hard they were from a physiological standpoint. The higher the Training Load is, the more difficult the activity was for your cardiovascular system.
Training Load is measured using volume (in minutes) and intensity (either HR or Pace, depending on the activity mode and intensity). In other words, you can increase this value by either increasing the duration of the activity or the intensity of it.
| Activity Modes | Intensity Used for Training Load Calculation |
|---|---|
| Road Running / Track | HR when Pace < Threshold Pace ; Effort Pace when pace > Threshold Pace |
| Trail Running | Effort Pace |
| Cycling | Power, HR if no power available |
| Other activities | HR |
Regardless of whether you are a runner, cyclist, or other sport enthusiast, Training Load is a universal way to quantify your training and measure your stress through activities over time. Because it's based on time and intensity, it allows you to compare the strain of workouts across different sports using the same metric.
Why do strength training activities produce low Training Load scores? By using the TRIMP method to calculate Training Load, we ensure high accuracy in all endurance activities that stress your cardiovascular system. However, this system has not been designed to accurately estimate the load for anaerobic or power activities that stress your neuromuscular system.
Examples
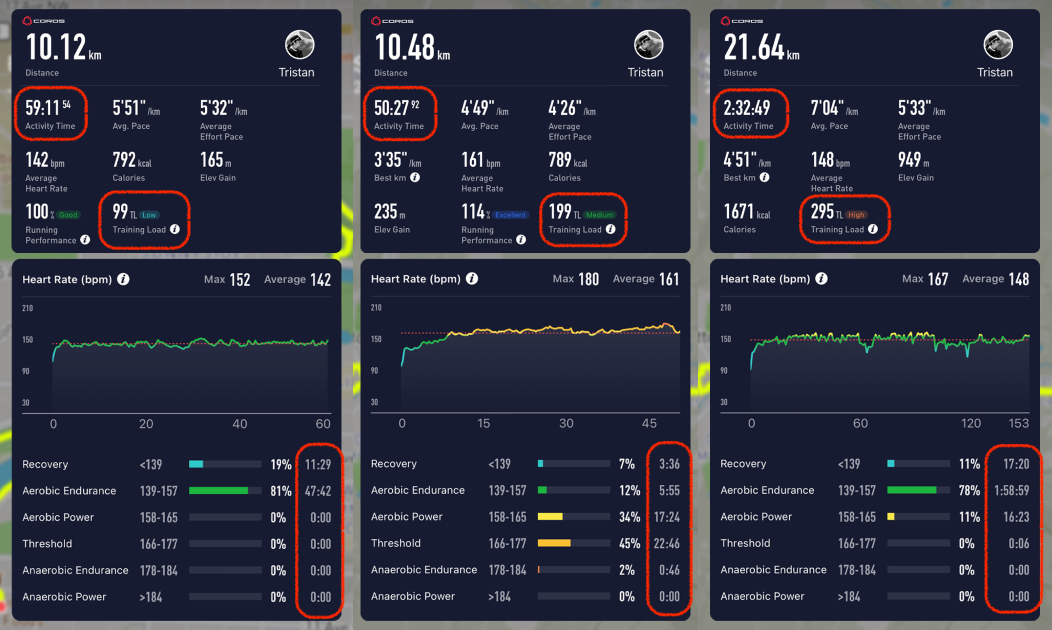
Run 1 (low duration, low intensity); Run 2 (low duration, high intensity); Run 3 (High duration, low intensity)
As we mentioned, Training Load is influenced by volume (duration) and intensity (HR mostly). These three examples above show how we can easily manipulate Training Load in our sessions.
- Run 1 has a duration of 50-60min with HR within zones 1-2. This workout produces a low TL score of 99.
- Run 2 has a similar duration of 50-60min, but HR has shifted to zones 3-4 mostly. This workout produces a medium TL score of 199.
- Run 3 has a longer duration of >2 hours, but with HR back in zone 2 mostly. This workout produces a high TL score of 295.
Heart rate response to exercise will vary among individuals, so while they may be working just as hard, some athletes will naturally receive higher training loads for their sessions than others. As a result, ranges for "Low", "Medium", and "High" will vary person-to-person, and metrics like Base Fitness will have the same individual variation.
Coach's Tip: To help you get more accurate Training Load scores for your workouts, we recommend wearing a Heart Rate Monitor and calibrating your training zones with the Running Fitness Test.
How to Monitor Training Load
At the end of the week (Monday through Sunday), EvoLab adds all your TL scores of the week to provide a Weekly Training Load score. This trend can be quickly seen through your COROS app, or be monitored more closely on your COROS Training Hub.
Do you use the 10% rule? The 10% rule refers to the progression you should be aiming for on a weekly basis. If your past Weekly Training Load was 1000, then you should aim for about 1100 for the following week for optimal progression. While many athletes follow the 10% rule using mileage, Training Load offers a more precise approach. Not all miles are equal, but all units of Training Load reflect both time and intensity, making it a better guide for safe, effective progression.
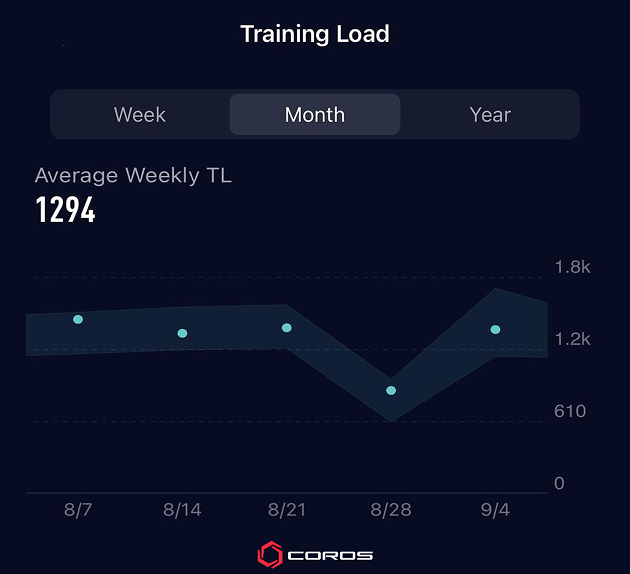
Weekly Training Load graph as seen in the COROS app.
The shaded area in the graph refers to a suggested Training Load range. EvoLab keeps learning about your training habits and will suggest a Weekly Training Load range for the upcoming week.
For most training plans, you may notice a progression in Weekly Training Load during 3-4 weeks followed by a recovery week, then back at it again. This is the proven way to make sure you are training efficiently towards your goals.
Why not a 7-day rolling total? While it might seem intuitive, a rolling total can create daily fluctuations that make it harder to track progress and adjust your training. Instead, the COROS Weekly Training Load graph resets on the same day each week, allowing for a clearer view of week-to-week trends. Plus, having a stable weekly snapshot enables more actionable recommendations and better planning. If you're looking for a rolling metric to understand current training stress, Load Impact serves that purpose by calculating your average load over the past 7 days.
Training Load Feeds Advanced Metrics
Base Fitness and Load Impact are two EvoLab metrics that are directly influenced by Training Load.
Every time you complete a session, the activity will have a Training Load value assigned to it. This value is then taken across EvoLab to update the rest of your metrics, like Base Fitness and Load Impact, which are calculated using Training Load over various lengths of time.
- Base Fitness is a 42-day rolling average of your Training Load, and is useful for learning about your long-term fitness.
- Load Impact is a 7-day rolling average of your Training Load, and is useful to illustrate the short-term stress your body is currently under.
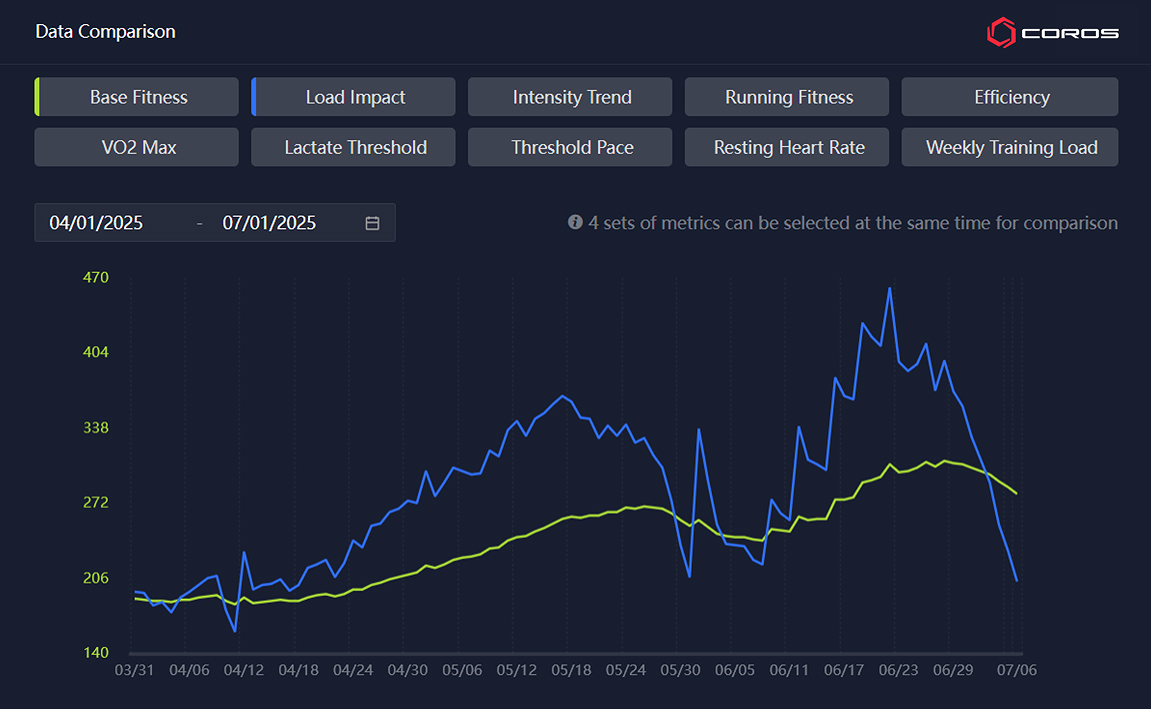
When comparing the ratio of these two you get your Training Status, which is another invaluable tool in analyzing your training.
Build Your Future with Training Load
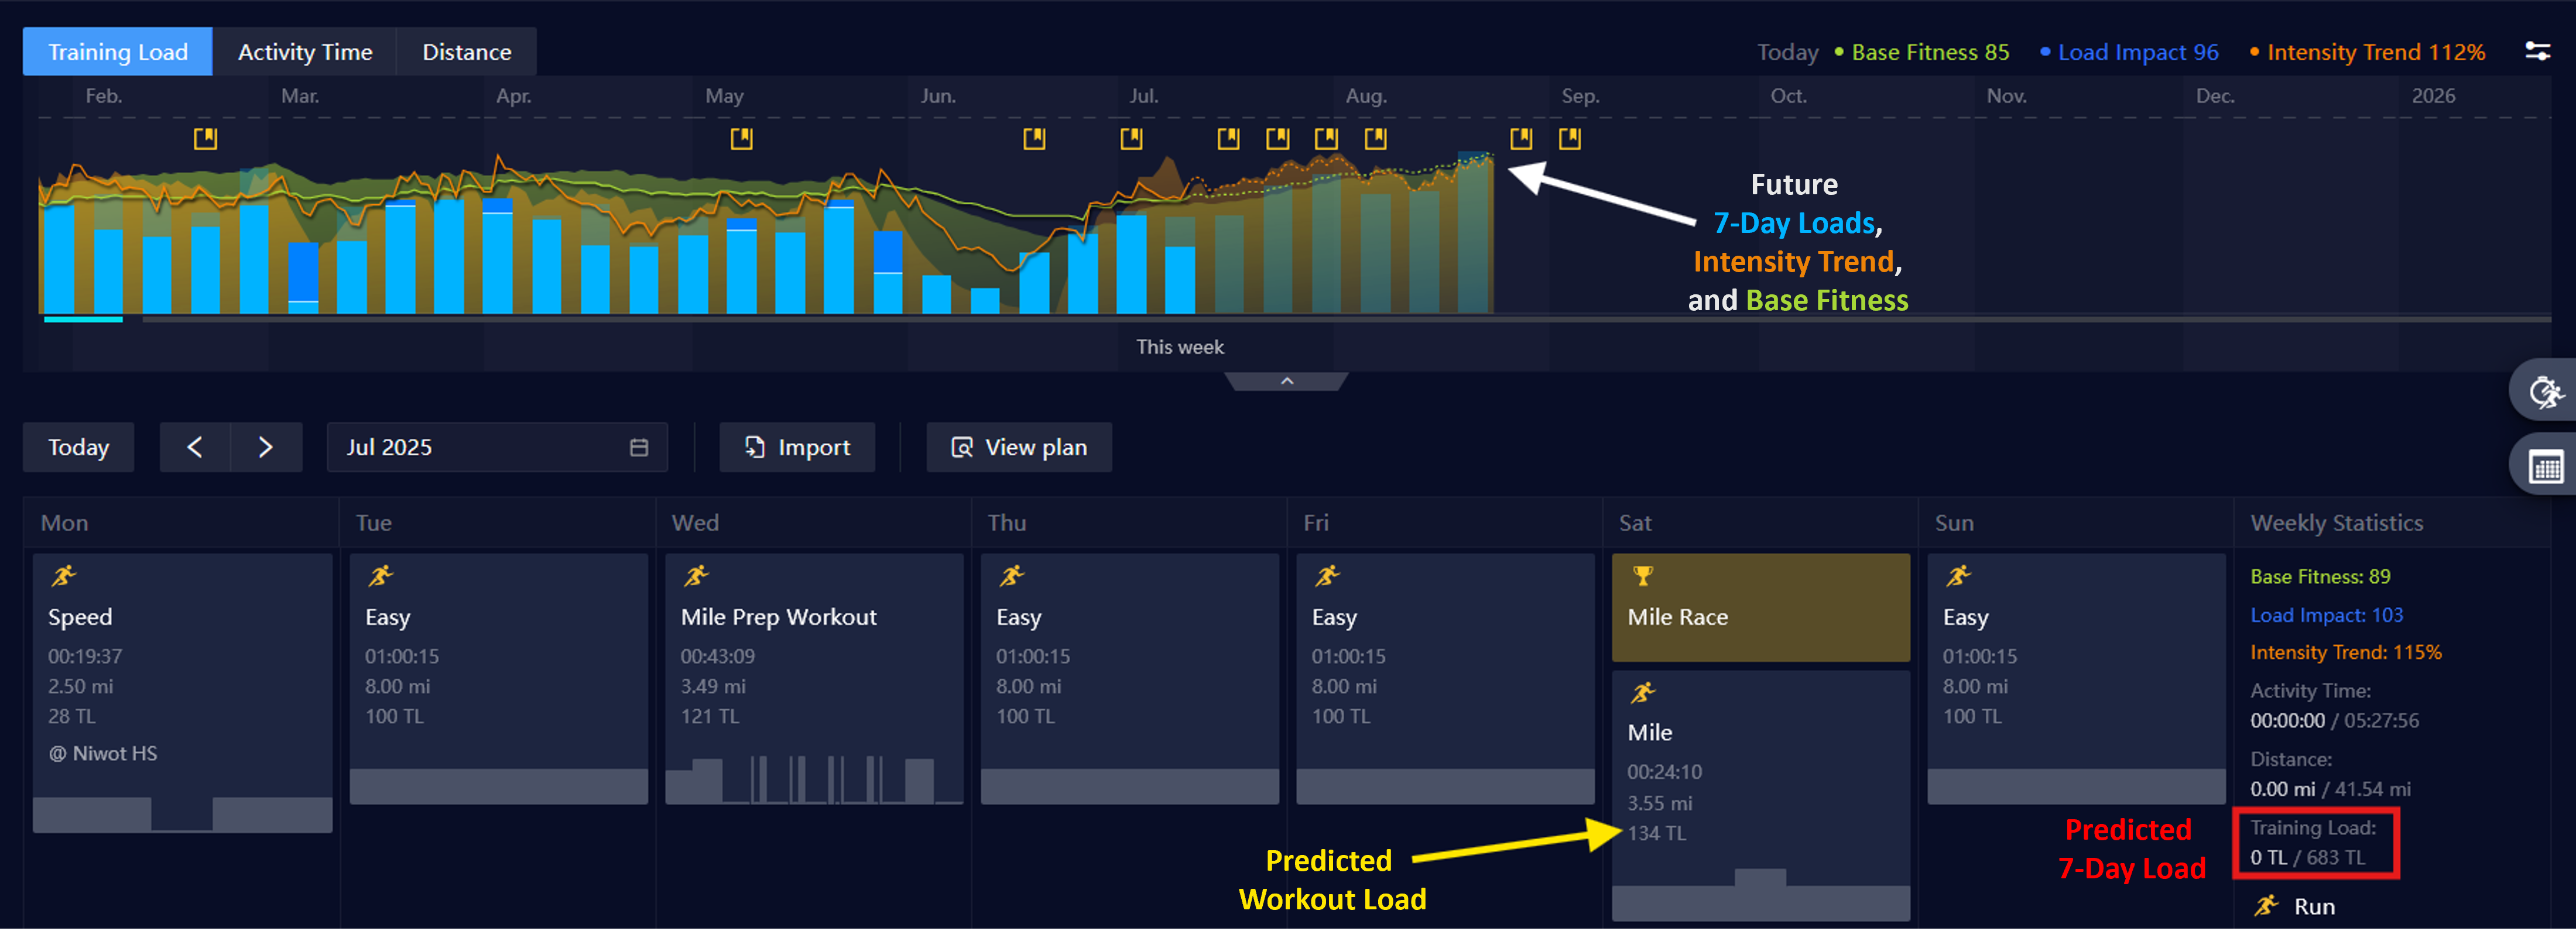
Training Load prediction with future training displayed in the Calendar tab of the Training Hub.
Since Training Load is calculated by measurable things like pace, heart rate, and time, that means we can predict Training Load for upcoming workouts if we know the right details. By scheduling your workouts in advance on Training Hub, you will be able to see a predicted Training Load for each individual session. When you plan weeks in advance, you'll also see predictions for Weekly Training Load, Base Fitness, and Intensity Trend. It's like a "What If?" calculator for your fitness.
For example, you can compare how an interval workout versus a long run might affect your Weekly Load and Base Fitness before you even step out the door. This lets you structure your training with precision, adjusting sessions to maintain steady progress while avoiding injury risk. Training Load is the full picture: tracking your past and present along with planning what you should do to get the best results.